
After you have computed a test statistic, a decision must be made. You must either reject or fail to reject the null hypothesis. This part is really easy. You compare the computed probability with your preset alpha level (you did set an alpha level before conducting your test didn’t you?) If the probability is less than alpha (less than .05 let us say), you reject the null hypothesis. If the computed probability is bigger than alpha, you fail to reject the null hypothesis. What makes this process a bit complicated is understanding your chances of being wrong—making what statistics folks call a decision error.
Alpha
Alpha is just a probability threshold that the researcher sets for rejecting the null hypothesis. The alpha level is set by the researcher at the very beginning of the data analysis process—before any test statistics are computed. Some researchers in the social sciences set the value at .05; others set it at the more demanding .01 level. If the probability of your observed relationship is less than the set alpha level (e.g., .01 or .05) then you will reject the null hypothesis.
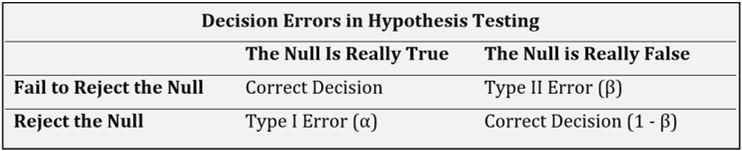
When it comes to making a decision regarding a null hypothesis, there are only four possible outcomes. If the null hypothesis is true (in the population) and you fail to reject it, you have made a correct decision. If the null hypothesis is false and you reject it, you have made a correct decision. The other two options are incorrect decisions. In other words, you have made a decision error. Researchers have named these Type I errors and Type II errors.
Alpha (α) is the probability threshold set by the researcher for rejecting the null hypothesis.
Type I Error
A Type I Error is also known as a false positive because we reject the null hypothesis when it is true. Thus, we have found a “positive” result when we should not have. Alpha (α) is the probability of a Type I Error. When we say that p < .05, we are saying that the chance of making a Type I Error is less than 5%. When we say that p < .01, we are saying that the chance of making a Type I Error is less than 1%.
A Type I error occurs when a researcher rejects a null hypothesis when it is true for the population.
In the realm of hypothesis testing, understanding the nuances of errors is crucial, as the conclusions drawn from such tests can influence decisions in various fields, from medicine to social sciences. One of the primary errors that statisticians and researchers are wary of is the Type I Error, often referred to as a false positive. This error occurs when the null hypothesis, which posits that there is no effect or no difference, is incorrectly rejected in favor of the alternative hypothesis. In simpler terms, a researcher or statistician believes they have found a significant result or effect when, in reality, none exists in the population. This could lead to unwarranted actions or decisions based on false assumptions, which could have considerable implications, especially in critical areas like clinical trials or public policy.
The probability of committing a Type I Error is denoted by the symbol alpha (α). It signifies the risk level that researchers are willing to take when deciding to reject the null hypothesis. Common thresholds for alpha include 0.05 and 0.01. When researchers state that p < .05, they are asserting that they are willing to accept a 5% chance of committing a Type I Error. This means there’s a 5% probability of falsely identifying an effect or difference when none exists. On a stricter note, when p < .01 is cited, it underscores a more conservative approach, indicating that the tolerance for making a Type I Error is set at a mere 1%. Such distinctions in alpha levels allow researchers to quantify and communicate the level of uncertainty they’re comfortable with when making statistical inferences from their data.
Type II Error
A Type II Error, also known as a false negative, occurs when the null hypothesis is, in reality, false (we should reject it) but we fail to do so based on our test results. Beta (β) is the Type II Error rate. This is closely related to the power of a statistical test, which is defined as 1 – β.
A Type II error occurs when a researcher fails to reject the null hypothesis when it should be rejected.
In statistical hypothesis testing, a Type II Error, often referred to as a false negative, represents a missed opportunity to correctly identify a genuine effect or difference. When such an error occurs, the test results suggest that the null hypothesis should be retained, even though, in reality, it should be rejected. Imagine the implications in the medical field, for instance: if a groundbreaking drug has a significant effect but a study erroneously concludes that it doesn’t, then patients could be denied a potentially life-changing treatment based on this oversight.
This error rate is represented by the term beta (β). However, when discussing the effectiveness of a statistical test, the conversation often shifts to its “power” rather than its susceptibility to Type II Errors. Power, which is calculated as 1 minus β, refers to the test’s ability to correctly identify an effect when one truly exists. A powerful test is more trustworthy and is less likely to overlook genuine effects. Therefore, power analysis is a crucial tool for researchers when designing their studies. By determining the appropriate sample sizes, researchers can enhance the power of a test, thereby minimizing the chances of committing Type II Errors and ensuring more reliable conclusions.
Summary
In hypothesis testing, once a test statistic is computed, a critical decision lies ahead: whether to reject or retain the null hypothesis. This determination hinges on a preset probability threshold known as alpha (α). Before any test is undertaken, researchers establish this threshold, commonly set at .05 or the more stringent .01. Essentially, if the test’s computed probability is below the alpha level (like p < .05), the null hypothesis is rejected. Yet, it’s imperative to grasp the inherent risk of errors in such decisions. Two primary errors can arise: Type I and Type II.
A Type I Error, often termed a “false positive,” emerges when the null hypothesis is wrongly rejected. In layman’s terms, the researcher mistakenly believes they’ve identified a significant effect when none exists in the broader population. The probability of making this error aligns with the alpha level; for instance, at p < .05, there’s a 5% chance of wrongly spotting a difference. Conversely, a Type II Error, labeled a “false negative,” arises when a real effect is overlooked, leading to the incorrect retention of the null hypothesis. Denoted by beta (β), this error rate is inversely related to a test’s “power”—the ability to correctly detect an effect. This power gauges a test’s robustness, and optimizing it ensures results are both accurate and meaningful.
Key Terms
Hypothesis, Sample, Population, Generalization, Inference, Test Statistic, Research Hypothesis, Null Hypotheses, p-values, Alpha Level, Type I Error, Type II Error, Power, Assumptions, One-tailed Test, Two-tailed Test
Last Modified: 09/25/2023