

Perhaps the most common method of controlling Type I error rates is using a test called the Tukey Honestly Significant Difference (HSD). The Tukey HSD is based on a variation of the t distribution that takes the number of means being compared into account. This distribution is called the studentized range distribution (See Appendix E for a table of critical values).
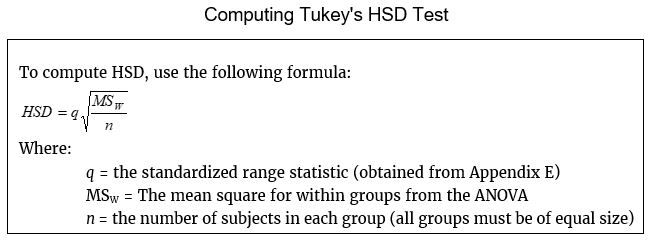

Once we obtain a value for HSD, we simply compare it to the observed difference between the means. If the observed difference between a pair of means is larger than HSD, we reject the null hypothesis. Of the observed difference between a pair of means is smaller than HSD, we fail to reject the null hypothesis.
Unfortunately, Excel does not support post hoc tests, although it will produce an ANOVA table with relative ease. A researcher conducting an ANOVA can produce those results in Excel, then make post hoc comparisons using the simple formula above.
Suppose that a researcher has three groups in an experiment and he runs a one-way ANOVA in Excel to get the following results:
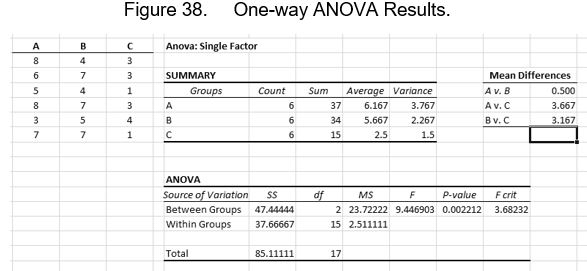

Note the Mean Differences table within Figure 38. This is not produced by the ANOVA function in Excel; it must be set up by the researcher using simple subtraction. We know from the ANOVA that at least one of the mean differences is significant, but we do not know which one. To find out, we can conduct post hoc tests. To do this, we must find the value for HSD for each possible comparison (in this example, there are 3).
To use the formula for HSD, we must first consult the table in Appendix E and find the value of q. To do this, we consult the ANOVA summary table and find the degrees of freedom for within groups. We consult the table and find where 15 degrees of freedom meets with 3 groups. The value of q, then, is 3.67. We can then plug these values into the HSD formula:
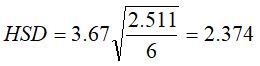

For the comparison A v. B, the observed difference was 0.500. Since 0.500 is not greater than 2.374, we fail to reject the null hypothesis. In other words, the difference between Group A and Group B is not statistically significant.
For the comparison A v. C, the observed difference was 3.667. Since 3.667 is larger than 2.374, we reject the null hypothesis. In other words, the difference between Group A and Group C is statistically significant.
For the comparison B v. C, the observed difference was 3.167. Since 3.167 is larger than 2.374, we reject the null hypothesis. In other words, the mean difference between Group A and Group B is statistically significant.
The Tukey test is one among a field of many post hoc tests, but it is probably the most commonly encountered.
Last Modified: 06/04/2021