
The actual formulas original proposed for d are quite different than the ones below. These are what many call computational formulas—the logic of why they work is not readily apparent. They have the advantage of being easy to compute and easy to enter into a spreadsheet, which is why we will use them rather than the more informative heuristic formulas.
r = sqrt( ( t2 ) / ( ( t2 ) + ( df * 1) ) )
d = (t*2) / (sqrt(df) )
Where:
r = Effect Size
d = Cohen’s d Value (Standardized Mean Difference)
t = t-Test Value
df = Degrees of Freedom.
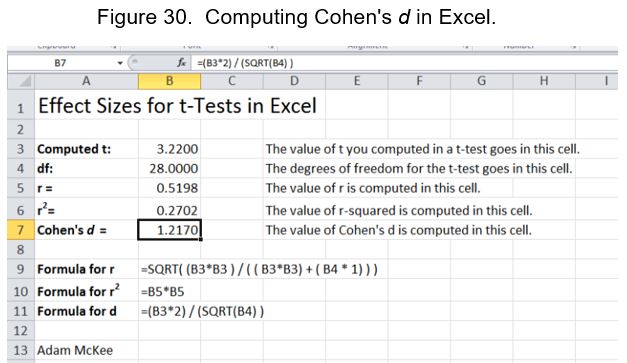
In Excel, SQRT is the square root function. For t-squared, just substitute the cell that you are using to enter t multiplied by itself. The df in the formula must be swapped out for the cell containing the df value. Here is an example of how this might look in Excel:
Last Modified: 06/04/2021