
In statistical analysis, particularly in regression, the slope is a measure of the relationship between the dependent variable (often denoted as Y) and an independent variable (X). In the context of a linear regression model, which is represented by the equation Y = aX + b, the slope (a) quantifies the rate at which Y changes for a unit change in X. Understanding the slope is vital because it conveys the strength and direction of the linear relationship between the two variables.
Excel provides a built-in function to calculate the slope of a regression line, known as the SLOPE function. This function is essential for those who need to understand the relationship between variables without delving into the mathematical complexities of regression analysis.
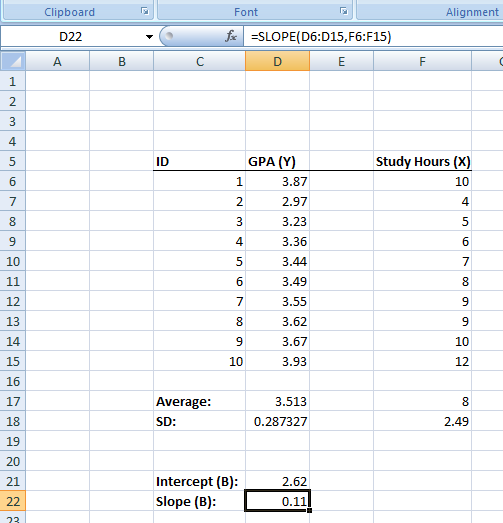
Understanding the Slope Function
The SLOPE function in Excel returns the slope of the linear regression line through data points in known_y’s and known_x’s. The slope is the rise over the run, the change in Y over the change in X. It’s a crucial part of the regression equation as it indicates how much Y is expected to increase when X increases by one unit.
In Excel, the SLOPE function provides what are known as non-standardized coefficients. This means that the coefficients are in the units of the original data and are not scaled to a standard range. Thus, the slope calculated by Excel represents the actual average change in the dependent variable for each one-unit change in the independent variable, allowing for a more intuitive understanding of the data.
Computing the Slope in Excel
When it comes to calculating the slope using Excel, the process is straightforward. Here’s a step-by-step guide:
- Organize Your Data: Ensure your X (independent variable) and Y (dependent variable) values are placed in two separate columns, adjacent to each other, for ease of reference.
- Selecting the Function: Click on the cell where you want the slope value to appear. Navigate to the ‘Formulas’ tab, choose ‘More Functions’, select the ‘Statistical’ category, and then click on ‘SLOPE’.
- Entering Data Ranges: In the dialog box that appears, input the range of your dependent variable (Y) data as ‘known_y’s’ and the range of your independent variable (X) data as ‘known_x’s’.
- Executing the Function: After specifying the data ranges, click ‘OK’. Excel will perform the calculations and display the slope in the selected cell.
- Interpreting the Result: The resulting value is the slope of the regression line. It represents the estimated change in the dependent variable for every one-unit change in the independent variable.
The Role of the Slope in Analysis
The slope is an indicator of the relationship’s strength. A larger absolute value of the slope indicates a stronger relationship between X and Y. If the slope is positive, there’s a positive correlation, meaning as X increases, Y also increases. Conversely, a negative slope indicates a negative correlation, where an increase in X corresponds to a decrease in Y.
Moreover, the slope is central to making predictions. Once you have the slope, you can use it along with the intercept to make predictions about Y based on new X values.
Practical Implications
The practical applications of the SLOPE function are vast. In business, it could be used to predict future sales based on past trends. In economics, it might be used to understand the relationship between supply and demand. In the natural sciences, it could model the relationship between various environmental factors.
Computing the Slope in Google Sheets
Google Sheets, like Excel, offers functions for performing various statistical analyses, including linear regression. The SLOPE function in Google Sheets is used to calculate the slope of the line of best fit through a set of data points in your spreadsheet. This slope represents the relationship between the dependent variable (Y) and the independent variable (X). Here are the step-by-step instructions to use the SLOPE function in Google Sheets:
Step-by-Step Usage of the SLOPE Function in Google Sheets
- Arrange Your Data:
- Place your dataset within Google Sheets with the independent variable (X) values in one column and the dependent variable (Y) values in the adjacent column.
- Ensure that each X value corresponds to a Y value in the same row and that the data contains no text or non-numeric characters, which could result in errors.
- Select the Output Cell:
- Click on the cell where you wish to display the slope of your regression line. This cell will be used to output the result from the SLOPE function.
- Enter the SLOPE Function:
- In the selected cell, type
=SLOPE(, and Google Sheets will typically show a tooltip with the function’s requirements, guiding you through the input process.
- In the selected cell, type
- Define Your Data Ranges:
- Click and drag over the range of cells that contain your Y values (dependent variable) to select them.
- After selecting the Y range, type a comma to separate the arguments.
- Next, click and drag over the range of cells that contain your X values (independent variable) to select them.
- Complete and Execute the Function:
- Close the parentheses to complete the function input, which should now look something like
=SLOPE(B2:B10, A2:A10), assumingB2:B10contains your Y values andA2:A10contains your X values. - Press
Enter, and the function will calculate the slope.
- Close the parentheses to complete the function input, which should now look something like
- Interpret the Calculation:
- The value that appears in your selected cell represents the slope of the regression line.
- It quantifies the change in the dependent variable (Y) for each one-unit change in the independent variable (X).
- Analyze the Result:
- A positive slope indicates a positive relationship between X and Y – as X increases, Y also tends to increase.
- A negative slope indicates a negative relationship – as X increases, Y tends to decrease.
- The magnitude of the slope suggests the strength of this relationship; a steeper slope (larger absolute value) indicates a stronger relationship.
By following these steps, you can efficiently calculate the slope of a regression line in Google Sheets, which is pivotal for data analysis, forecasting, and interpreting the quantitative relationship between two variables.
Last Modified: 11/07/2023