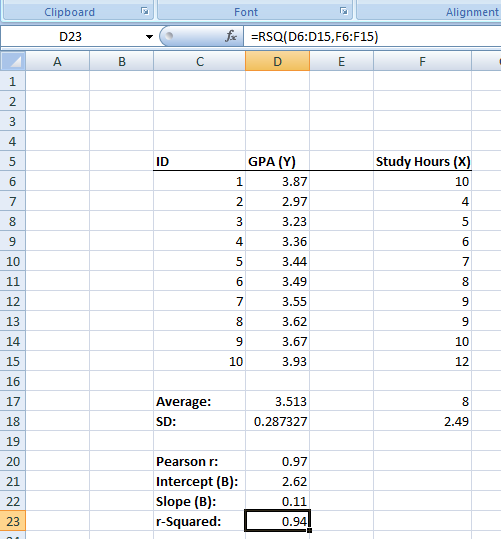
To compute the coefficient of determination, use the RSQ function.
Key Terms
Covariance, correlation, Correlation Coefficient, Pearson’s r, Scattergram, Scatterplot, x-axis, y-axis, linear relationship, positive relationship, negative relationship, Inverse Relationship, Direct Relationship, Regression Line, Trendline, Bivariate, Multiple Correlation, Coefficient of Determination
Important Symbols
![]()
Last Modified: 02/18/2019[amazon_link asins=’1983091049′ template=’ProductCarousel’ store=’thereferencepage’ marketplace=’US’ link_id=’f6d2aba5-7e38-11e8-a89f-0f73c296ad50′]