

Variance is an essential concept in statistics, often overshadowed by its more popular counterpart, the standard deviation. While the two are intricately linked, understanding the unique role and significance of variance can provide valuable insights, especially in the realm of social research. Let’s embark on a journey to uncover the nuances of variance and master its computation in Excel.
Understanding Variance
The relationship between variance (often symbolized by σ^2) and standard deviation (denoted as s or SD) is intimate and straightforward: variance is the square of the standard deviation. At first glance, one might wonder, “Why introduce an additional term when it’s directly derived from the standard deviation?” The answer lies in its practical applications.
While it’s true that variance is seldom reported in isolation within the scientific literature, it’s not due to its lack of importance. Instead, it’s because the unit of variance isn’t as intuitive as that of standard deviation. Standard deviation gives us a measure of spread that can be understood in the same units as the data. In contrast, variance is in squared units, making it less interpretable for a casual reader.
However, variance shines in more advanced statistical techniques, especially in methodologies where squared differences or weights play a crucial role. It’s this mathematical convenience that often makes variance the preferred measure in various analytical scenarios.
The Role of Variance in Social Research
In social research, understanding variability is pivotal. Data seldom exhibits a perfect uniformity; there are always nuances, differences, and deviations. Variance quantifies this spread, encapsulating the average of squared differences from the mean.
For instance, when analyzing survey results or experimental data, researchers might observe patterns or trends. However, it’s the spread of this data – the variance – that can often be more enlightening. It provides insights into the consistency or diversity of responses, feelings, or observations, painting a fuller picture of the social landscape.
By leveraging variance, social researchers can gauge the reliability of a scale, the homogeneity of a group, or the variability within a population segment. While standard deviation offers similar insights, the squared nature of variance makes it particularly handy in certain analytical and modeling contexts.
Step-by-Step: Computing Variance
In its essence, computing variance is straightforward. If you have the standard deviation (s) of a dataset, the variance (σ^2) can be found by simply squaring this value. In fact, you compute the variance along the way to computing standard deviation!
By knowing the standard deviation, one can easily transition to understanding variance. The challenge, however, often lies in computing the standard deviation, especially for large datasets or when using specific software tools.
Mastering Variance in Excel
Excel, a ubiquitous tool in both academic and professional realms, offers a seamless method to compute variance. If you’ve ever been daunted by the idea of calculating variance in Excel, fret not. The process is intuitive and user-friendly.
Here’s a step-by-step guide:
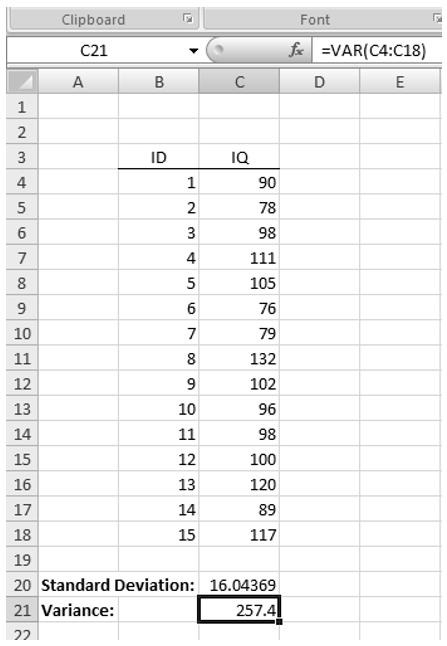
- Gather Your Data: Begin by inputting your dataset into an Excel column. Let’s say you have a list of scores or values in column A.
- Locate the VAR Function: In the toolbar, navigate to the ‘Formulas’ tab. Under ‘More Functions’, select ‘Statistical’, and then choose ‘VAR’. This function is tailor-made for computing variance.
- Apply the Function: After selecting ‘VAR’, a function arguments window will pop up. Here, select the range of cells containing your data. If your scores are in cells A1 to A10, for example, input ‘A1:A10’.
- Evaluate: Once the range is set, press OK. Excel will then compute and display the variance of your dataset.

Computing Variance in Google Sheets
Google Sheets, a popular online spreadsheet tool, provides a comprehensive suite of functions to assist users in various statistical calculations. If you’re making the shift from Excel or exploring Google Sheets for the first time, this step-by-step guide on computing variance will surely come in handy.
Step-by-Step: Variance Calculation in Google Sheets
- Input Your Data: Start by entering your dataset into a column in your Google Sheet. For instance, if you’re working with a list of scores, you might choose to place each score in a separate row within column A.
- Locate the Appropriate Function: Google Sheets offers two primary functions for computing variance:
VAR.P(): This function computes the population variance.VAR.S(): This is used to compute the sample variance.
For most practical scenarios, especially when dealing with a subset of data (sample) and not the entire population, you’ll be using
VAR.S(). - Apply the Function:
- Click on an empty cell where you’d like the variance value to be displayed.
- Type
=followed by the function name, i.e.,=VAR.S(. - Select the range of cells containing your data. If your data spans cells A1 through A10, for example, your function would look like this:
=VAR.S(A1:A10). - Hit ‘Enter’.
- Review the Result: Google Sheets will instantly compute and display the variance of the selected dataset in the cell where you typed the function.
Notes & Considerations
- Google Sheets distinguishes between population variance and sample variance, so always ensure you’re using the right function. If unsure, default to
VAR.S()unless you are certain you have data from an entire population. - Always check your data range to ensure you haven’t missed any data points or accidentally included any irrelevant data.
Final Thoughts
Computing variance in Google Sheets is a straightforward process, thanks to the user-friendly functions provided by the platform. Whether you’re conducting academic research, managing business data, or merely exploring datasets out of personal interest, understanding variance and being able to calculate it efficiently in tools like Google Sheets is an invaluable skill. With these steps at your fingertips, you’re well-equipped to dive into data analysis with confidence.
Wrapping Up
Variance, despite being less intuitive than standard deviation, is a cornerstone of statistical analysis. Its utility in advanced statistical methods, coupled with its importance in social research, underlines the need for every researcher, student, or data enthusiast to understand and appreciate its essence.
By equipping oneself with the knowledge of variance and mastering its computation in tools like Excel, one can harness the true potential of data, unveiling patterns, insights, and intricacies that might otherwise remain obscured. So, the next time you’re delving into data analysis, remember to give variance the attention it rightly deserves.
Key Terms
Standard Deviation, Variance
Last Modified: 10/16/2023