
Let’s dive into a kind of research that’s a bit messier than what we’ve seen before—quasi-experiments. Think of a true experiment as a neatly planted garden where everything is organized, and you know exactly where each plant will go. Now, imagine a forest—wild and complex; that’s like a quasi-experiment.
In a true experiment, researchers use a special trick called randomization to sort people into different groups. This is like drawing names out of a hat to decide who goes where. But in a quasi-experiment, the researcher can’t use that hat trick. Why? Because the groups are already formed based on things that have already happened or characteristics people already have—like whether they’re left-handed or right-handed or how old they are.
When Do We Use Quasi-Experiments?
Some things in life just can’t be assigned by drawing names out of a hat. You can’t decide who’s going to be older or younger, or who has blue eyes or brown. That’s when quasi-experiments come into play. They help us study what we can’t control.
Plus, there are certain things that would be just plain wrong to study by creating them on purpose. For example, nobody in their right mind would think about trying to figure out the effects of not eating on purpose or the impact of something really harmful to learn about it. Those are big no-nos. That’s not only unfair but also unethical and against the rules that researchers must follow. So, for those tricky topics, researchers use quasi-experiments because they’re the next best thing.
Looking Backwards with Quasi-Experiments
Quasi-experiments have a special superpower—they can look back in time. Imagine you’re a detective trying to solve a mystery about why something happened. Quasi-experiments let researchers be like detectives, piecing together clues from the past. For example, if someone wants to understand how human intelligence has changed over thousands of years, they can’t exactly run an experiment on it—time machines don’t exist! Instead, they look at the information from long ago and use that to make smart guesses.
The Nonequivalent Control Group Design
What is the Nonequivalent Control Group Design?
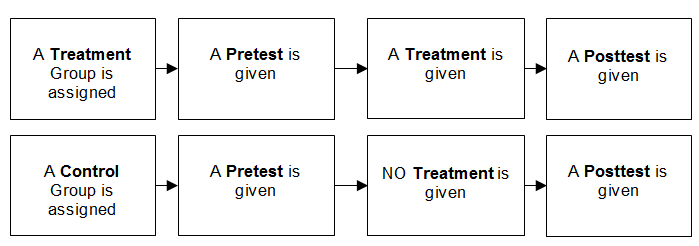
Alright, let’s chat about a type of research setup that’s like a cousin to the experiments we’ve already talked about. It’s called the “Nonequivalent Control Group Design.” Sounds a bit complicated, right? Don’t worry, we’ll break it down.
Imagine you’re doing a science project, and you have two plants that you want to test fertilizer on. You’ve got Plant A and Plant B. In a perfect science experiment, you’d choose these two randomly, but sometimes you don’t get to pick. Let’s say Plant A is the one that’s been sitting in your window, and Plant B is the one from the corner of your classroom. They’re your two groups, and you didn’t pick them by drawing straws; they were already there, and that’s just how it is.
How Does It Work?
In this design, researchers have to work with groups that are already formed, just like Plant A and Plant B. These groups might be different classes in a school, people from different towns, or any other groups that naturally exist.
The trick here is that because you didn’t get to mix up and sort these groups completely by chance, they might not start off the same. Maybe Plant A always got more sunlight, or Plant B was watered a little less. In research terms, this means we’re not totally sure if the two groups were similar, to begin with, and that’s why we call them “nonequivalent.”
Why “Nonequivalent”?
The word “nonequivalent” basically means “not equal to start with.” Since the groups in this design weren’t created by randomly picking who goes where there’s a chance they might be different in ways we didn’t plan. That can make it tricky to be sure, later on, if any changes we see are really due to what we’re testing (like the fertilizer on our plants) or because of the differences that were there from the start.
The Static Group Comparison
What’s the Static Group Comparison?
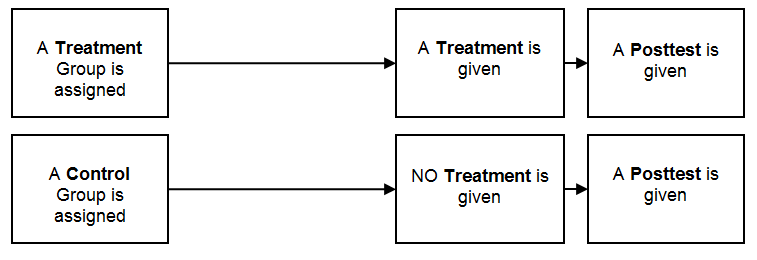
Imagine you want to find out if a new way of teaching math helps students get better grades. But there’s a catch—you can’t pick which students try the new method randomly, and you can’t check their math skills with a test before you start. This is where the Static Group Comparison comes into play.
It’s a lot like the Nonequivalent Control Group Design we talked about before, but it’s even simpler. Think of it as a before-and-after picture without the “before.”
Why Use This Design Carefully?
Using the Static Group Comparison is a bit like walking through a dark room without a flashlight—you have to be super careful. Since you don’t have a pretest to see how the students were doing before the new teaching method, you can only compare the two groups after the fact. It’s like trying to guess who won a race without knowing where the starting line was.
The reason researchers have to be extra careful is that without choosing students randomly or having a pretest, it’s hard to say for sure if the new teaching method is what made the difference in grades. Maybe the students who did better had a better breakfast that day, or maybe they just like math more. Without the pretest, it’s tricky to know.
A Quick Reality Check
In the perfect world of research, we’d always have a clear “before” and “after” and we’d pick our groups by chance, but in the real world, that can’t always happen. That’s why the Static Group Comparison exists—it’s not perfect, but sometimes it’s the best option a researcher has.
Studying Change across Time
Have you ever wondered how people change as they get older? Some researchers are super curious about this too. They use what’s called the longitudinal method to study the same group of people multiple times over a period, like checking in on a group of kids each year as they grow up.
Picture this: a researcher wants to see if teenagers are less likely to get into trouble as they get older. They pick a group of 12-year-old kids and follow them all the way until they’re 45, gathering info every single year. That’s a long time, right? That’s why it’s called “longitudinal,” because it stretches over a long line of time.
This method is pretty cool because it’s like having a time-lapse video of someone’s life. The same people are in it from start to finish, which helps the researcher see exactly how they change without worrying too much about other random things messing up the results.
But there are downsides: it’s like a movie that takes forever to film and costs a lot of popcorn—lots of time, lots of money. Plus, just like how some actors might leave a movie set, some people might move away or decide not to be part of the study anymore, and that can make it tricky to keep the story clear.
The Cross-Sectional Method: The Group Snapshot
Now, let’s talk about the cross-sectional method. This one’s kind of like taking a big group photo at a family reunion. Instead of following the same people over time, researchers take a look at different people all at once. They might gather a bunch of people of different ages on the same day and see how they’re all doing.
It’s a faster and cheaper way to get an idea of how things might change with age because you’re not waiting years to see what happens. It’s just one snapshot, one quick peek at how people are different at different ages.
But here’s the catch: because you’re looking at different people, it’s harder to be sure that the differences you see are really about age. It might be like comparing your quirky Aunt Edna who loves cats to your cousin who’s all about video games—they’re just different people!
Summary
Quasi-experiments are the untamed territory of research methods, lacking the orderly precision of true experiments. They forgo the luxury of randomization, assigning groups based on pre-existing conditions like age or a specific characteristic. They’re particularly useful when ethical or practical limitations prevent random assignment.
When to Opt for Quasi-Experiments
Quasi-experiments are the go-to when randomization is off the table—be it due to ethical concerns or the impracticality of manipulating certain variables. They’re invaluable for exploring the impacts of naturally occurring variables.
Quasi-Experiments: The Retrospective Lens
These experiments have a knack for retrospective analysis, allowing researchers to infer causality from historical data. This method is crucial for investigating phenomena over long periods, where direct experimentation isn’t possible.
The Nonequivalent Control Group Design Unpacked
In this design, researchers leverage existing groups, acknowledging the innate differences. Although lacking randomization, this approach still provides comparative insights, assuming the inherent nonequivalence is accounted for.
Navigating the Static Group Comparison
The Static Group Comparison simplifies the nonequivalent control group design by excluding the pretest phase, demanding a cautious approach due to increased validity threats.
Advantages and Challenges of Longitudinal Studies
Longitudinal studies offer the benefit of observing changes over time within the same subjects, providing a consistent data set. However, they’re time-intensive and suffer from potential participant dropout over time.
The Cross-Sectional Method: A Snapshot in Time
Alternatively, cross-sectional studies offer a quicker, more economical glimpse into the age-related differences across a diverse sample at a single point in time, with the trade-off being less control over extraneous variables.
Modification History

File Created:  07/25/2018

Last Modified:  11/06/2023
You are welcome to print a copy of pages from this Open Educational Resource (OER) book for your personal use. Please note that mass distribution, commercial use, or the creation of altered versions of the content for distribution are strictly prohibited. This permission is intended to support your individual learning needs while maintaining the integrity of the material.

This work is licensed under an Open Educational Resource-Quality Master Source (OER-QMS) License.
![]()