

So far, we have considered the scientific approach in very general terms. In our discussion of evaluating literature, we mentioned some different types of research that you should distinguish in your notes. This chapter will provide a more in-depth treatment of the several different types of research. Keep in mind that this single chapter will only brush the surface—entire books exist on each of the methods we will discuss. You are directed to the best of these in the “references and further reading” section at the end of the chapter. For our purposes, we will divide the major types of designs into three categories: 1) Quantitative designs, 2) qualitative designs, and 3) evaluation designs.
Quantitative Designs
The term quantitative suggests that the researcher using this family of research methods will seek to use numbers as a critical element in their efforts to develop explanations, make predictions, and provide methods to control the social world. This is opposed to methods that primarily use words (i.e., qualitative research). This also suggests that the researcher will use statistical methods to describe and make inferences about those numbers. In this section, we will focus on how those numbers are gathered in a systematic way. In later sections, we will see how those numbers are analyzed using statistical methods.
Description
Descriptive research methods seek to explain “what is” in the social world. That is, they describe the characteristics of variables in particular social contexts. Descriptive research projects can stand alone or can be integrated into more advanced types of studies. A very common type of descriptive study in the social sciences is the survey. The basic purpose of most survey research is to describe the status quo.
Another common type of descriptive study is the observational study. Observational studies describe people based on unobtrusive observations. Naturalistic observation involves unstructured (unsystematic) observations of a wide range of behaviors or situations. Participant observation involves the investigator “infiltrating” the group being observed and taking part in group activities.
Relationships
Researchers often ask questions about the relationship between two or more variables. For example, is there a relationship between poverty and crime? Is there a relationship between drug use and domestic violence? When two variables are related in such a way as our examples suggest, they are said to be correlated. Because of this, relational research designs are often called correlational designs. In these types of designs, the researcher is asking two interrelated questions. The first question is “Are these two variables correlated?” If they are, then the question becomes “How strong is the correlation between these variables?”
There are several different types of correlations. The most common distinction is between positive and negative correlations. When a correlation is a positive correlation, it means that the two variables increase together and decrease together. In other words, if one goes up, then the other one goes up with it. If one goes down, the other one goes down with it. The second type of correlation is the negative correlation. When two variables have a negative correlation, one variable will go up when the other goes down.
We’ll get into more detail about how correlations work in a later section. For now, consider how researchers gather data for correlational studies. The most common method is to make observations in the “real world” as opposed to under controlled experimental conditions (such as those in a laboratory). This method results in a paired set of numbers that represent variables as they were in a single cross-section of time. The important thing about this is that the researcher did not manipulate the variables; they were simply observed and recorded. This means three important things that place limits on correlational studies:
No cause and effect relationship can be determined. As we will discuss in the next section, cause-and-effect relationships are best determined by conducting true experiments. Correlational studies are inappropriate for this purpose.
Other variables could explain observations. A false assumption that a correlation actually exists when in only appears to exist is known as a spurious correlation. For example, let us say that a researcher is interested in the correlation between A and B. The researcher gathers data for both A and B, and performs some calculations. There is a correlation! The researcher concludes that A causes B. This is a mistake! Another explanation is that another variable (one not considered by our researcher)—let us call it C—is causing both A and B.
The direction of the effect cannot be determined. In our A and B example, the researcher assumed that A caused B. A correlation is not enough to support this conclusion since the numbers (the computed correlation) would be identical if in fact B were causing A.
Single Subject Research Designs
Among those social scientists that seek to alter human behavior such as educationists, therapists, and social workers, there exists a need to determine the value of a particular course of treatment on a single individual or a small number of individuals. In these applied research situations, often the best method is the single-subject research design. Single-subject designs include several basic characteristics: repeated measures of the subject, baseline performance, intervention measures, and experimental controls.
A-B-A-B Designs
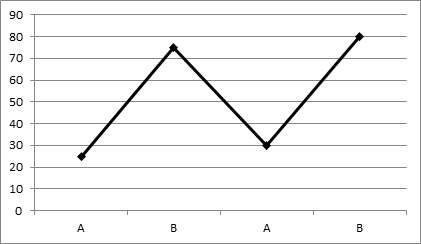
The first A in the sequence stands for the researcher taking a baseline measurement. The first B stands for the introduction of a treatment. The second A stands for the researcher removing the treatment for a period, and the second B stands in for the reintroduction of the treatment.
With single subject designs, there is little use for inferential statistics that depend on large groups of subjects to make inferences about a population. Rather, single subject designs usually use simple line graphs to demonstrate the effect of the independent variable on the subject. Most commonly, the A-B-A-B sequence runs along the horizontal axis and the value of the dependent variable runs along the vertical axis. If dependent scores go up with the treatment, then we expect to see the lines rise at the B points and fall at the A points. If the dependent variable shrinks with the introduction of the treatment, then we expect to see the line fall from A to B. The figure below illustrates this type of data presentation.

A variant of this design is to give different treatments to different subjects so that the results can be compared. The analysis of this type of study is similar to the single-subject analysis depicted above, except that there are two or more lines on the graph, one for each subject. Another variant is to examine more treatments, extending the number of As and Bs in the analysis. This is useful when the researcher is interested in the impact of more long-term treatment strategies.
Modification History

File Created:  07/25/2018

Last Modified:  11/01/2023
You are welcome to print a copy of pages from this Open Educational Resource (OER) book for your personal use. Please note that mass distribution, commercial use, or the creation of altered versions of the content for distribution are strictly prohibited. This permission is intended to support your individual learning needs while maintaining the integrity of the material.

This work is licensed under an Open Educational Resource-Quality Master Source (OER-QMS) License.
![]()
