
The mode represents a vital concept in statistics, especially when it comes to survey data. Often, researchers are more interested in the most frequently occurring response rather than the average or midpoint of a set of scores. As an example, consider a scenario where a researcher seeks to understand the dominant political party affiliation among a group of respondents.
Decoding a Survey
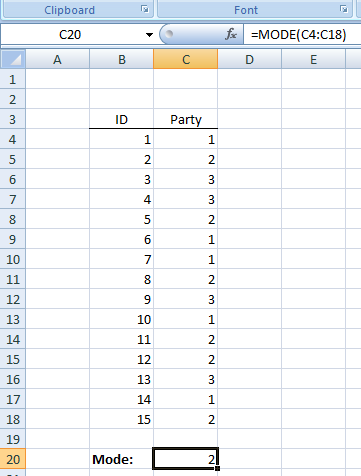
In our illustrative survey, respondents could align with one of three political parties: Democrat, Republican, or Independent. To simplify data analysis, the researcher assigned numerical values to these affiliations as follows:
- Democrat = 1
- Republican = 2
- Independent = 3
The conversion of qualitative data (like party affiliation) into a quantitative form (numeric codes) is a common practice in research. This process not only standardizes the data but also makes it conducive for various analyses.
Using the MODE Function in Excel
To determine which political party affiliation was the most common among respondents, the researcher can employ Excel’s MODE function.
Step-by-Step Guide
- Input Data: Enter your coded data in an Excel column. In our case, you’ll have a series of 1s, 2s, and 3s based on respondents’ party affiliations.
- Activate the MODE Function: Click on an empty cell where you want the mode result to appear. Then, navigate to the Excel formula bar and type
=MODE(A1:A100), assuming your data range is from A1 to A100. Press Enter. - Interpret the Result: Excel will display the mode in the cell you selected. If, for instance, the mode is “1”, it means “Democrat” was the most frequently chosen affiliation among respondents.
Choosing the Right Measure of Central Tendency
Now, while the mode might be a vital tool in some research scenarios, it’s just one of several measures of central tendency. Deciding which measure to use requires a strategic approach:
- The Mean: Ideally, when in doubt, lean towards the mean. Not only is it the most well-known measure of central tendency, but it is also crucial when paired with advanced statistical techniques. We’ll delve deeper into these techniques in future sections, but for now, remember that the mean provides an arithmetic average, representing a “balance point” in your dataset.
- The Median: If your data set is skewed due to extreme scores (either too high or too low), the median becomes a better choice. Since the median is the middle value in an ordered list of numbers, it remains unaffected by outliers, giving a more representative central value.
- The Mode: As illustrated with the political party example, when dealing with nominal data (data that names or labels categories), the mode is your go-to measure. Nominal data doesn’t have an inherent order, making other measures of central tendency like mean or median inappropriate.
In conclusion, understanding and selecting the right measure of central tendency is pivotal in research. It not only helps in summarizing vast datasets but also ensures that the insights drawn from them are accurate and meaningful.
Key Terms
Measures of Central Tendency, Mean, Median, Mode
Important Symbols
Last Modified: 09/27/2023