
In this book, we delve into a wide range of statistical methods that can be computed using Microsoft Excel, one of the most widely used and powerful spreadsheet programs available today. Excel offers versatile features that make it a valuable tool for anyone interested in data analysis, from beginners to professionals. Whether you are looking to perform simple tasks like finding the average of a data set, or more complex analyses like regression models and hypothesis testing, Excel provides a robust platform for executing these tasks with a high degree of accuracy.
However, it’s important to note that Excel’s full suite of data analysis capabilities is not available in the standard setup. To unlock its complete range of statistical functions, you’ll need to install the Data Analysis ToolPak, an add-on that significantly expands Excel’s analytical prowess. This ToolPak can be found in the Tools menu of Excel, under the option labeled ‘Data Analysis.’
If you don’t see this option in your menu, it means that the ToolPak is not yet installed on your version of Excel. To remedy this, you can search for “Data Analysis Tools” in Excel’s Help section for step-by-step installation instructions. Alternatively, you can refer to the box below this paragraph for a brief explanation on how to enable this crucial feature. With the Data Analysis ToolPak enabled, you’ll be well-equipped to apply the statistical methods discussed in this book.
The word data is actually the plural of datum; datum refers to a single value, while data refers to a collection of values.
Understanding Functions in Excel
To make the most out of Microsoft Excel, particularly for tasks involving statistical computations, mastering the use of functions is crucial. In Excel, a function is essentially a predefined formula set up to perform a specific calculation. Unlike custom formulas that you might create on the fly, functions come built-in with Excel and are designed to make complex calculations more straightforward. Whether you want to find the average of a data set, calculate the standard deviation, or perform more advanced statistical analyses, Excel likely has a function for it. The use of functions not only simplifies the task at hand but also minimizes the likelihood of errors that can occur when manually typing out long, complicated formulas.
Importance of Rows and Columns in Spreadsheets
Before diving into Excel functions for statistical computations, it’s essential to have a basic understanding of the layout of an Excel spreadsheet, especially the concept of rows and columns. In the grid-like structure of an Excel sheet, lines of numbers that go up and down are organized in columns, which are labeled with letters (A, B, C, etc.). On the other hand, the lines of numbers running from left to right are called rows, and these are labeled with numbers (1, 2, 3, etc.). Grasping these basic definitions is key to efficiently using Excel functions, as most functions will require you to specify the range of rows and columns on which you wish to perform a calculation.
Locating and Using Functions
To begin using functions in Excel, you can either type them directly into the formula bar or use the ‘Insert Function’ dialog box, typically represented by an ‘fx’ symbol. Typing functions directly can be faster but requires you to remember the specific syntax for each function. On the other hand, using the ‘Insert Function’ dialog offers the advantage of a guided interface, providing you with options to fill in arguments and showing you a preview of the output. You would usually need to specify the cells, or the range of cells (covering specific rows and columns), that the function will act upon.
Common Statistical Functions in Excel
Excel offers a wide array of statistical functions tailored to various needs. For instance, the AVERAGE function can quickly calculate the mean of a given data range, while the STDEV.P and STDEV.S functions are designed to compute the population and sample standard deviations, respectively. Other useful statistical functions include MEDIAN for finding the middle value in a data set, MODE for identifying the most frequently occurring number, and CORREL for assessing the correlation between two sets of data. Each of these functions streamlines what would otherwise be a tedious calculation, making it easier for individuals to focus on interpreting the results rather than getting bogged down in computations.
Advantages of Mastering Excel Functions
Learning how to effectively utilize Excel’s functions can significantly enhance your productivity and accuracy in statistical analysis. Not only do functions save time, but they also bring a level of precision that might be difficult to achieve with manual calculations. Furthermore, the knowledge of functions can be easily transferable between different projects or tasks, making it a valuable skill in various professional settings. As the backbone of Excel’s computational capabilities, a solid grasp of functions—coupled with an understanding of rows and columns—lays the foundation for making the most out of this powerful software.
A Simple Example
Let us say we want to do something simple like compute the average for a quiz taken by our statistics class. We can set up an Excel sheet to do the job as follows:
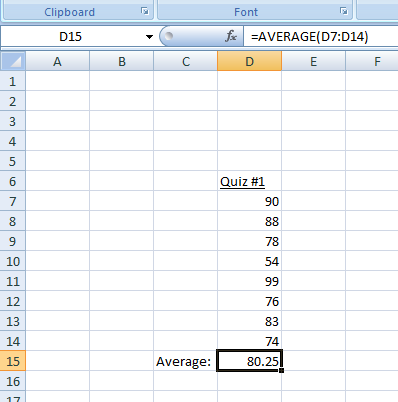
Note that all of the quiz scores are placed in a column. The value 80.25 is the average (mean). The value was not typed in, however. Excel put it there. What was typed in was the function. Functions may look a little complicated at first, but they are very easy to use once you understand the anatomy. In the function bar at the top of the table, we see the syntax =AVERAGE(D7:D14). All functions in Excel begin with an equal sign. That is how Excel knows it is a function and not just text or numbers. We could have placed the function in any cell, but it makes sense to put it at the end of the column. AVERAGE is the name of the predefined function that we are using to compute the mean. The (D7:D14) tells Excel to compute the average of the range of cells D7 through D14.
To insert a function automatically, first, click on the cell where you want to place the function. Then, under the formulas tab, click insert function. This will open the insert function dialog box. Most of the functions we will be using will be found under the “statistical” category.
Last Modified: 09/06/2023